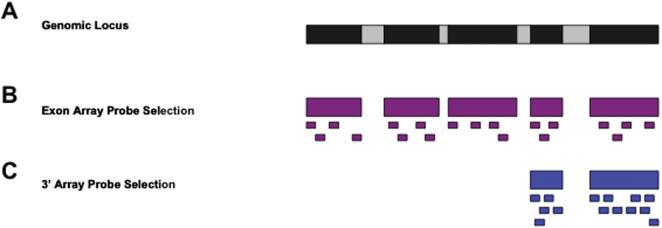
Figure 1. Probe design of exon arrays.
(A) Exon-intron structure of a gene.
Black boxes represent exons. Gray boxes represent introns. Introns are not drawn to scale.
(B) Probe design of exon arrays.
Exon arrays have four probes targeting each exon of the gene.
(C) Probe design of 3′ expression arrays.
Probes on 3′ expression arrays target 3′ end of the mRNA sequence.

