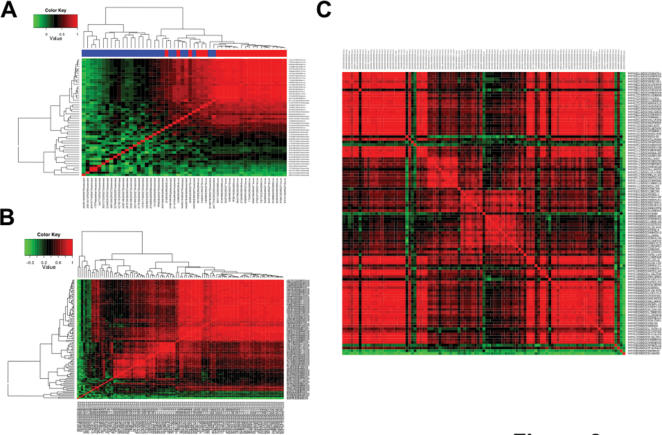
Figure 2. Heatmap visualization of exon array pairwise probe correlations.
(A) Heatmap visualization of probe intensities of HLA-DMB (transcript cluster 2950263).
Each cell of the heatmap shows the correlation of two probes in 11 tissues.
The top color bar indicates the probe type.
Core probes are colored in red.
Extended probes are colored in blue.
The signal intensities of core probes usually have a high correlation (the top right corner of the heatmap).
(B) Heatmap visualization of probe intensities of core probes in CD44 (transcript cluster 3326635).
Probes targeting the 5′ and 3′ regions (constitutive exons) of CD44 show highly correlated signals in 11 tissues (the top right corner of the heatmap).
(C) Heatmap visualization of probe intensities of core probes in CD44 (transcript cluster 3326635).
Probes are ordered from top to bottom based on their genomic coordinates (5′ to 3′).

