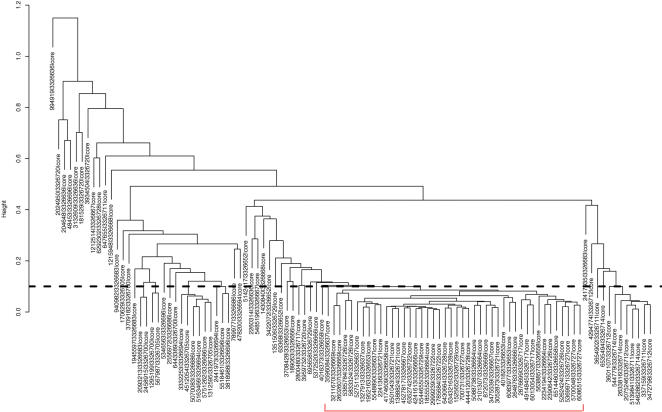
Figure 3. Hierarchical clustering of probe intensities of CD44 core probes.
Core probes of CD44 are clustered by average linkage hierarchical clustering based on their intensities in 11 tissues (a total of 33 samples).
The distance metric is (1-Pearson correlation coefficient).
A total of 44 core probes are selected when we cut the clustering dendrogram at h = 0.1 (indicated by the dashed horizontal line).

