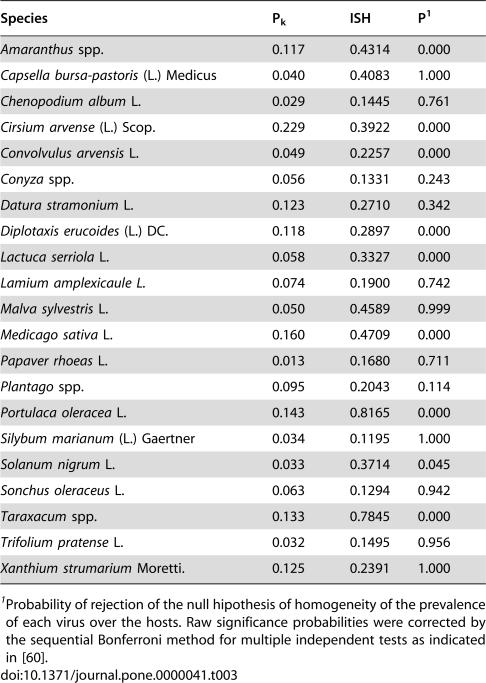
Table 3. Average prevalence of virus infection (Pk), and index of selectivity of the host (ISH) for twenty one weed species.
| Species | Pk | ISH | P1 |
| Amaranthus spp. | 0.117 | 0.4314 | 0.000 |
| Capsella bursa-pastoris (L.) Medicus | 0.040 | 0.4083 | 1.000 |
| Chenopodium album L. | 0.029 | 0.1445 | 0.761 |
| Cirsium arvense (L.) Scop. | 0.229 | 0.3922 | 0.000 |
| Convolvulus arvensis L. | 0.049 | 0.2257 | 0.000 |
| Conyza spp. | 0.056 | 0.1331 | 0.243 |
| Datura stramonium L. | 0.123 | 0.2710 | 0.342 |
| Diplotaxis erucoides (L.) DC. | 0.118 | 0.2897 | 0.000 |
| Lactuca serriola L. | 0.058 | 0.3327 | 0.000 |
| Lamium amplexicaule L. | 0.074 | 0.1900 | 0.742 |
| Malva sylvestris L. | 0.050 | 0.4589 | 0.999 |
| Medicago sativa L. | 0.160 | 0.4709 | 0.000 |
| Papaver rhoeas L. | 0.013 | 0.1680 | 0.711 |
| Plantago spp. | 0.095 | 0.2043 | 0.114 |
| Portulaca oleracea L. | 0.143 | 0.8165 | 0.000 |
| Silybum marianum (L.) Gaertner | 0.034 | 0.1195 | 1.000 |
| Solanum nigrum L. | 0.033 | 0.3714 | 0.045 |
| Sonchus oleraceus L. | 0.063 | 0.1294 | 0.942 |
| Taraxacum spp. | 0.133 | 0.7845 | 0.000 |
| Trifolium pratense L. | 0.032 | 0.1495 | 0.956 |
| Xanthium strumarium Moretti. | 0.125 | 0.2391 | 1.000 |
Probability of rejection of the null hipothesis of homogeneity of the prevalence of each virus over the hosts. Raw significance probabilities were corrected by the sequential Bonferroni method for multiple independent tests as indicated in [60].

