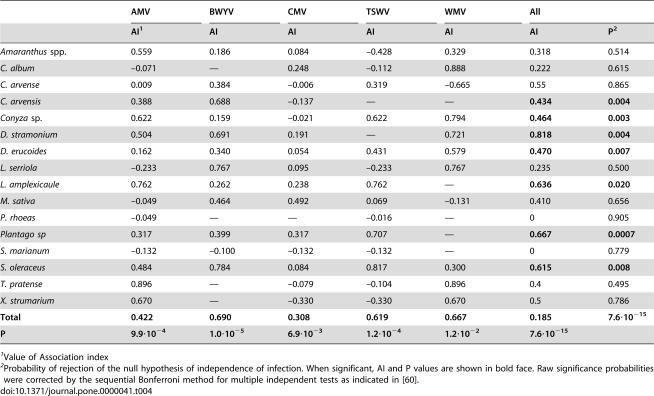
Table 4. Analysis of association among five virus species in sixteen host plant species.
| AMV | BWYV | CMV | TSWV | WMV | All | ||
| AI1 | AI | AI | AI | AI | AI | P2 | |
| Amaranthus spp. | 0.559 | 0.186 | 0.084 | –0.428 | 0.329 | 0.318 | 0.514 |
| C. album | –0.071 | — | 0.248 | –0.112 | 0.888 | 0.222 | 0.615 |
| C. arvense | 0.009 | 0.384 | –0.006 | 0.319 | –0.665 | 0.55 | 0.865 |
| C. arvensis | 0.388 | 0.688 | –0.137 | — | — | 0.434 | 0.004 |
| Conyza sp. | 0.622 | 0.159 | –0.021 | 0.622 | 0.794 | 0.464 | 0.003 |
| D. stramonium | 0.504 | 0.691 | 0.191 | — | 0.721 | 0.818 | 0.004 |
| D. erucoides | 0.162 | 0.340 | 0.054 | 0.431 | 0.579 | 0.470 | 0.007 |
| L. serriola | –0.233 | 0.767 | 0.095 | –0.233 | 0.767 | 0.235 | 0.500 |
| L. amplexicaule | 0.762 | 0.262 | 0.238 | 0.762 | — | 0.636 | 0.020 |
| M. sativa | –0.049 | 0.464 | 0.492 | 0.069 | –0.131 | 0.410 | 0.656 |
| P. rhoeas | –0.049 | — | — | –0.016 | — | 0 | 0.905 |
| Plantago sp | 0.317 | 0.399 | 0.317 | 0.707 | — | 0.667 | 0.0007 |
| S. marianum | –0.132 | –0.100 | –0.132 | –0.132 | — | 0 | 0.779 |
| S. oleraceus | 0.484 | 0.784 | 0.084 | 0.817 | 0.300 | 0.615 | 0.008 |
| T. pratense | 0.896 | — | –0.079 | –0.104 | 0.896 | 0.4 | 0.495 |
| X. strumarium | 0.670 | — | –0.330 | –0.330 | 0.670 | 0.5 | 0.786 |
| Total | 0.422 | 0.690 | 0.308 | 0.619 | 0.667 | 0.185 | 7.6·10−15 |
| P | 9.9·10−4 | 1.0·10−5 | 6.9·10−3 | 1.2·10−4 | 1.2·10−2 | 7.6·10−15 | |
Value of Association index
Probability of rejection of the null hypothesis of independence of infection. When significant, AI and P values are shown in bold face. Raw significance probabilities were corrected by the sequential Bonferroni method for multiple independent tests as indicated in [60].

