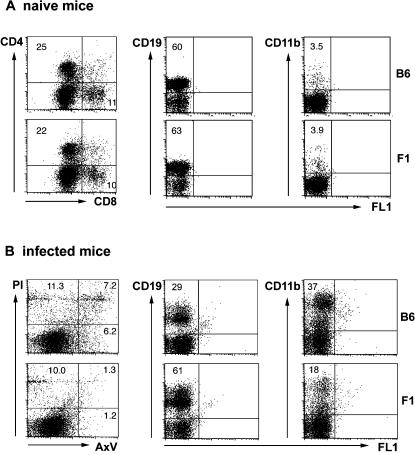
Figure 3. Cellular composition of the spleen from naive and T. cruzi- infected mice.
Single spleen cell suspensions from naive mice (A) and from mice infected on day 24 with T. cruzi (B) were analysed by flow cytometry.
Cells were stained for both CD4 and CD8, for CD19, for CD11b, or with propidium iodide (PI) and Annexin V (AxV).
Numbers indicate percentage of cells expressing the respective marker.
B6, C57BL/6 mice; F1, B6D2F1 mice.

