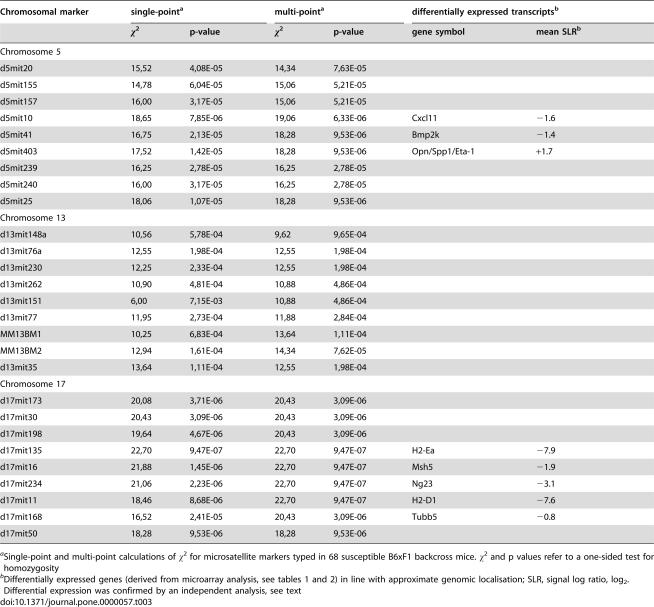
Table 3. susceptibility loci in B6 mice, and transcripts of genes encoded in these genomic regions that are differentially expressed between T. cruzi- infected B6 and F1 mice.
| Chromosomal marker | single-pointa | multi-pointa | differentially expressed transcriptsb | |||
| χ2 | p-value | χ2 | p-value | gene symbol | mean SLRb | |
| Chromosome 5 | ||||||
| d5mit20 | 15,52 | 4,08E-05 | 14,34 | 7,63E-05 | ||
| d5mit155 | 14,78 | 6,04E-05 | 15,06 | 5,21E-05 | ||
| d5mit157 | 16,00 | 3,17E-05 | 15,06 | 5,21E-05 | ||
| d5mit10 | 18,65 | 7,85E-06 | 19,06 | 6,33E-06 | Cxcl11 | −1.6 |
| d5mit41 | 16,75 | 2,13E-05 | 18,28 | 9,53E-06 | Bmp2k | −1.4 |
| d5mit403 | 17,52 | 1,42E-05 | 18,28 | 9,53E-06 | Opn/Spp1/Eta-1 | +1.7 |
| d5mit239 | 16,25 | 2,78E-05 | 16,25 | 2,78E-05 | ||
| d5mit240 | 16,00 | 3,17E-05 | 16,25 | 2,78E-05 | ||
| d5mit25 | 18,06 | 1,07E-05 | 18,28 | 9,53E-06 | ||
| Chromosome 13 | ||||||
| d13mit148a | 10,56 | 5,78E-04 | 9,62 | 9,65E-04 | ||
| d13mit76a | 12,55 | 1,98E-04 | 12,55 | 1,98E-04 | ||
| d13mit230 | 12,25 | 2,33E-04 | 12,55 | 1,98E-04 | ||
| d13mit262 | 10,90 | 4,81E-04 | 10,88 | 4,86E-04 | ||
| d13mit151 | 6,00 | 7,15E-03 | 10,88 | 4,86E-04 | ||
| d13mit77 | 11,95 | 2,73E-04 | 11,88 | 2,84E-04 | ||
| MM13BM1 | 10,25 | 6,83E-04 | 13,64 | 1,11E-04 | ||
| MM13BM2 | 12,94 | 1,61E-04 | 14,34 | 7,62E-05 | ||
| d13mit35 | 13,64 | 1,11E-04 | 12,55 | 1,98E-04 | ||
| Chromosome 17 | ||||||
| d17mit173 | 20,08 | 3,71E-06 | 20,43 | 3,09E-06 | ||
| d17mit30 | 20,43 | 3,09E-06 | 20,43 | 3,09E-06 | ||
| d17mit198 | 19,64 | 4,67E-06 | 20,43 | 3,09E-06 | ||
| d17mit135 | 22,70 | 9,47E-07 | 22,70 | 9,47E-07 | H2-Ea | −7.9 |
| d17mit16 | 21,88 | 1,45E-06 | 22,70 | 9,47E-07 | Msh5 | −1.9 |
| d17mit234 | 21,06 | 2,23E-06 | 22,70 | 9,47E-07 | Ng23 | −3.1 |
| d17mit11 | 18,46 | 8,68E-06 | 22,70 | 9,47E-07 | H2-D1 | −7.6 |
| d17mit168 | 16,52 | 2,41E-05 | 20,43 | 3,09E-06 | Tubb5 | −0.8 |
| d17mit50 | 18,28 | 9,53E-06 | 18,28 | 9,53E-06 | ||
Single-point and multi-point calculations of χ2 for microsatellite markers typed in 68 susceptible B6xF1 backcross mice. χ2 and p values refer to a one-sided test for homozygosity

