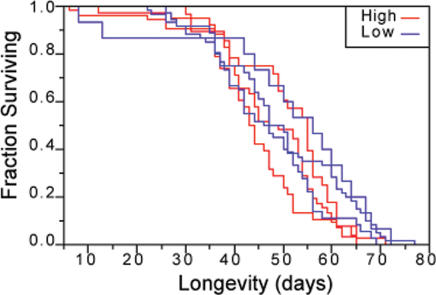
Figure 2. Survival curves for high and low dfe lines.
For simplicity, male and female values were grouped and equal numbers of each sex within each line are represented.
Multiple independent comparisons failed to detect longevity differences between high and low lines (Table 1).

