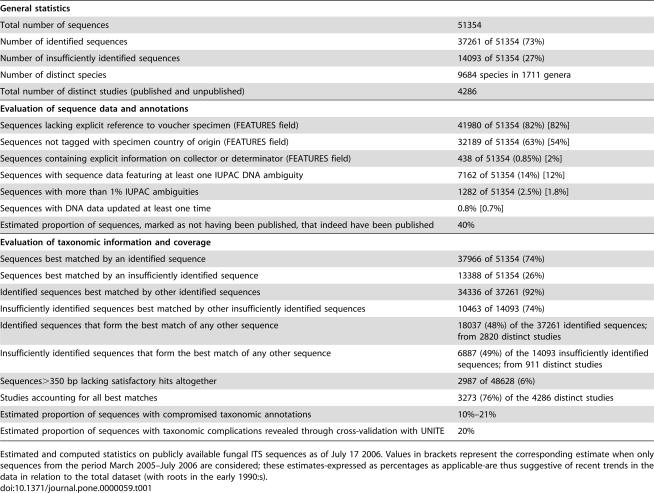
Table 1. A fungal perspective on data reliability in INSD.
| General statistics | |
| Total number of sequences | 51354 |
| Number of identified sequences | 37261 of 51354 (73%) |
| Number of insufficiently identified sequences | 14093 of 51354 (27%) |
| Number of distinct species | 9684 species in 1711 genera |
| Total number of distinct studies (published and unpublished) | 4286 |
| Evaluation of sequence data and annotations | |
| Sequences lacking explicit reference to voucher specimen (FEATURES field) | 41980 of 51354 (82%) [82%] |
| Sequences not tagged with specimen country of origin (FEATURES field) | 32189 of 51354 (63%) [54%] |
| Sequences containing explicit information on collector or determinator (FEATURES field) | 438 of 51354 (0.85%) [2%] |
| Sequences with sequence data featuring at least one IUPAC DNA ambiguity | 7162 of 51354 (14%) [12%] |
| Sequences with more than 1% IUPAC ambiguities | 1282 of 51354 (2.5%) [1.8%] |
| Sequences with DNA data updated at least one time | 0.8% [0.7%] |
| Estimated proportion of sequences, marked as not having been published, that indeed have been published | 40% |
| Evaluation of taxonomic information and coverage | |
| Sequences best matched by an identified sequence | 37966 of 51354 (74%) |
| Sequences best matched by an insufficiently identified sequence | 13388 of 51354 (26%) |
| Identified sequences best matched by other identified sequences | 34336 of 37261 (92%) |
| Insufficiently identified sequences best matched by other insufficiently identified sequences | 10463 of 14093 (74%) |
| Identified sequences that form the best match of any other sequence | 18037 (48%) of the 37261 identified sequences; from 2820 distinct studies |
| Insufficiently identified sequences that form the best match of any other sequence | 6887 (49%) of the 14093 insufficiently identified sequences; from 911 distinct studies |
| Sequences>350 bp lacking satisfactory hits altogether | 2987 of 48628 (6%) |
| Studies accounting for all best matches | 3273 (76%) of the 4286 distinct studies |
| Estimated proportion of sequences with compromised taxonomic annotations | 10%–21% |
| Estimated proportion of sequences with taxonomic complications revealed through cross-validation with UNITE | 20% |
Estimated and computed statistics on publicly available fungal ITS sequences as of July 17 2006. Values in brackets represent the corresponding estimate when only sequences from the period March 2005–July 2006 are considered; these estimates-expressed as percentages as applicable-are thus suggestive of recent trends in the data in relation to the total dataset (with roots in the early 1990:s).

