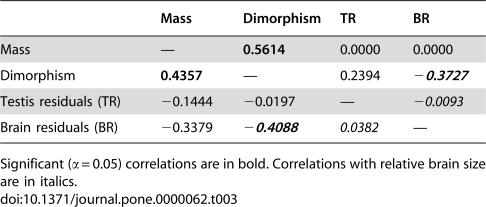
Table 3. Pearson correlation coefficients among variables (listed above the diagonal) and independent contrasts (listed below the diagonal).
| Mass | Dimorphism | TR | BR | |
| Mass | — | 0.5614 | 0.0000 | 0.0000 |
| Dimorphism | 0.4357 | — | 0.2394 | −0.3727 |
| Testis residuals (TR) | −0.1444 | −0.0197 | — | −0.0093 |
| Brain residuals (BR) | −0.3379 | −0.4088 | 0.0382 | — |
Significant (α = 0.05) correlations are in bold. Correlations with relative brain size are in italics.

