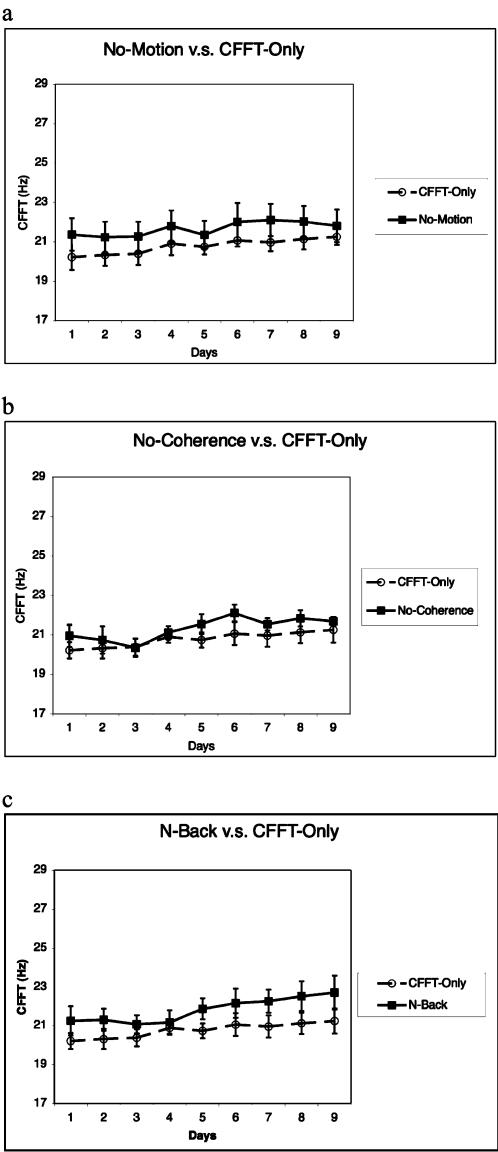
Figure 4. CFFT changes for control groups.
a, CFFT is shown for each day for the No-Motion Group (solid-line) and the Flicker-Only Group (dashed-line).
b, CFFT is shown for each day for the No-Coherence Group (solid-line) and the Flicker-Only Group (dashed-line).
a, CFFT is shown for each day for the N-Back Group (solid-line) and the Flicker-Only Group (dashed-line).
Error bars reflect standard-error.

