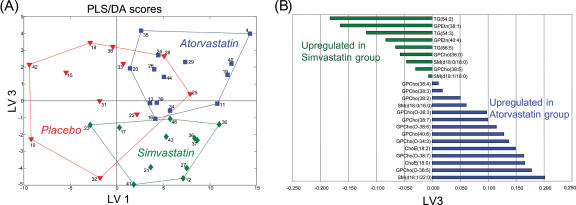
Figure 1. Partial least squares discriminant analysis (PLS/DA) of serum lipidomics data.
Results after 8 week treatment from placebo (N = 11), atorvastatin (N = 14), and simvastatin (N = 12) groups, with 132 identified lipid species included in analysis as variables. For each molecular species and each subject, its level after the 8 week treatment period was scaled by subtracting its median level across all subjects prior to treatment and divided by corresponding standard deviation. Four latent variables were used in the model (Q 2 = 0.46). The labels are patient ID numbers. The lines outlining different groups are shown as a guide. (A) The scores for Latent Variables (LV) 1 and 3 reveal serum lipid changes specific to the statin treatment (LV1) as well as statin-specific changes (LV3). (B) Loadings on LV3 for most important lipids in simvastatin or atorvastatin groups selected by VIP analysis. Only lipids for which at least one of the two groups has VIP value greater than 2 are shown.

