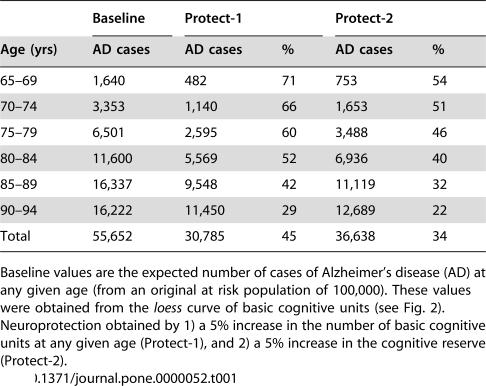
Table 1. Effect of neuroprotection on Alzheimer's disease (AD).
| Baseline | Protect-1 | Protect-2 | |||
| Age (yrs) | AD cases | AD cases | % | AD cases | % |
| 65–69 | 1,640 | 482 | 71 | 753 | 54 |
| 70–74 | 3,353 | 1,140 | 66 | 1,653 | 51 |
| 75–79 | 6,501 | 2,595 | 60 | 3,488 | 46 |
| 80–84 | 11,600 | 5,569 | 52 | 6,936 | 40 |
| 85–89 | 16,337 | 9,548 | 42 | 11,119 | 32 |
| 90–94 | 16,222 | 11,450 | 29 | 12,689 | 22 |
| Total | 55,652 | 30,785 | 45 | 36,638 | 34 |
Baseline values are the expected number of cases of Alzheimer's disease (AD) at any given age (from an original at risk population of 100,000). These values were obtained from the loess curve of basic cognitive units (see Fig. 2). Neuroprotection obtained by 1) a 5% increase in the number of basic cognitive units at any given age (Protect-1), and 2) a 5% increase in the cognitive reserve (Protect-2).

