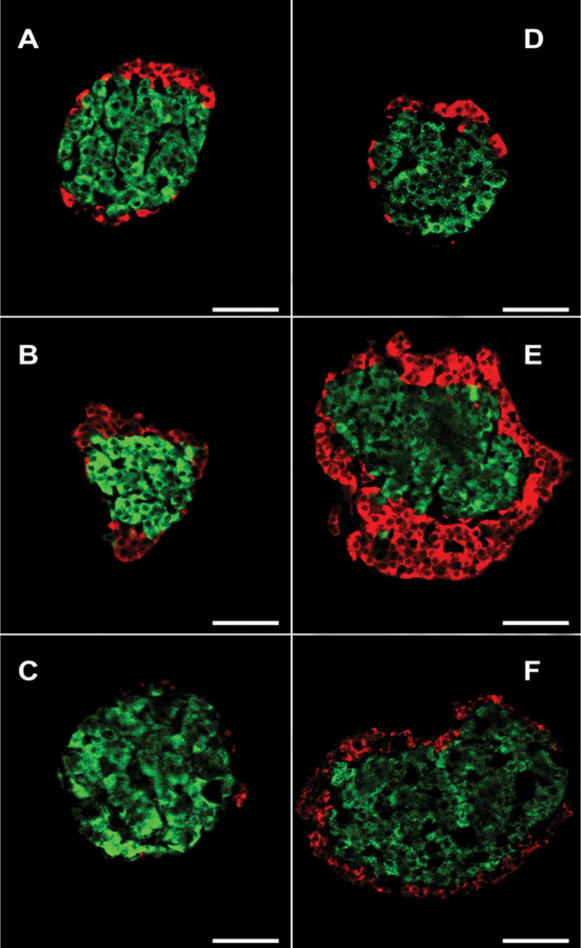
Figure 3. Islet composition changes in pancreatic head and tail at d6, 20 and adults.
Photomicrographs illustrate the overall distribution of alpha (red) and beta (green) cells in representative islets of the head (A–C) and body/tail (D–F) at d6 (A and D), d20 (B and E) and adults (C and F).
Scale bar = 50 µm.

