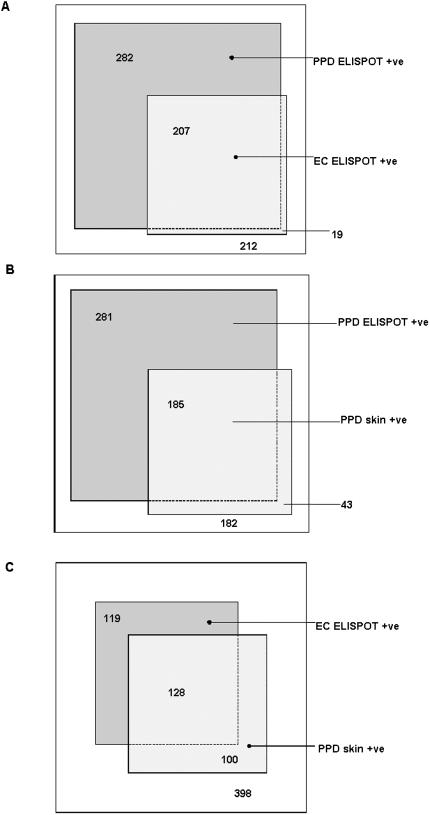
Figure 3.
Scaled rectangular diagrams showing relative proportions of TB case contacts who are PPD skin test positive and/or ELISPOT test result positive in relation to each other.
The sizes of the boxes are proportional to the relative number of individuals they represent and the numbers represent numbers of individuals.
A. PPD ELISPOT and ESAT-6/CFP-10 (EC) ELISPOT (n = 720)
B. PPD ELISPOT and PPD skin test (n = 691)
C. ESAT-6/CFP-10 ELISPOT and PPD skin test (n = 691)

