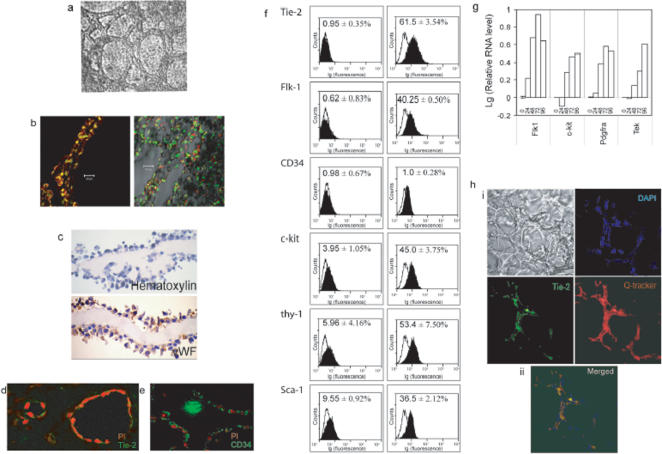
Figure 3. Differentiation of E-RoSH cells.
In vitro differentiation a) Morphology of E-RoSH2.1 cell culture two weeks after plating E-RoSH2.1 cells on matrigel coated plate, b) The patent E-RoSH2.1 derived tubular structures were labeled with CFDA, a cytoplasmic green fluorescent dye (Molecular Probe, Eugene, OR) and propidium iodide, and viewed by confocal microscopy (left panel).
The tubular structures were incubated with acetylated red fluoresecent diI-labelled LDL (Molecular Probe, Eugene, OR) for 24 hours and counterstained with SYTOX Green™, a green fluorescent nuclear dye (Molecular Probe, Eugene, OR) before analysis by confocal microscopy (right panel). c–e) Immunoreactivity for vWF, Tie-2 and CD34 on sections of E-RoSH2.1 derived tubular structures. vWF immunoreactivity was visualized using HRP-based detection system.
Brown precipitates indicate positive staining.
The nuclei were stained with Mayer's hematoxylin. CD34 and Tie-2 immunoreactivities were detected using secondary antibodies conjugated with FITC.
Nuclei were counterstained with PI. f) Flow cytometry analysis of E-RoSH2.1 cells for endothelial markers before (right panels) and 60 hours after (left panels) induction of differentiation by plating cells on matrigel.
Nonspecific fluorescence was determined by incubation of similar cell aliquots with isotype-matched mouse monoclonal antibodies or with secondary antibody alone.
g) Gene expression during in vitro differentiation of E-RoSH2.1 cells on matrigel as measured by quantitative RT-PCR analysis.
Relative gene expression is normalized against that at time 0 and expressed as a logarithmic function.
h) In vivo differentiation. 1×10⁵ E-RoSH2.1 cells labeled with Qdot® nanocrystals (655 nm emission) were injected into a ESC-derived teratoma that was induced in SCID mice.
Three days later, the mice were euthanized and the tumors were removed.
The tumors were fixed in 4% paraformaldehyde and cryosectioned at 20 µm thickness.
The sections were assayed for Tie-2 immunoreactivity using rabbit anti-Tie-2 followed by FITC-conjugated goat anti-rabbit antibody, and counterstained with DAPI. i.
A typical section of a capillary plexus in the teratoma as viewed by phase contrast microscopy (top left panel), stained with DAPI, a nuclear stain (top right panel), stained with using rabbit anti-Tie-2 (bottom left panel), and cells labelled with Qdot (bottom right panel). ii. Merging of the three fluorescent stains.
Yellow fluorescence indicates co-localisation of Qdot and FITC-conjugated antibody.

