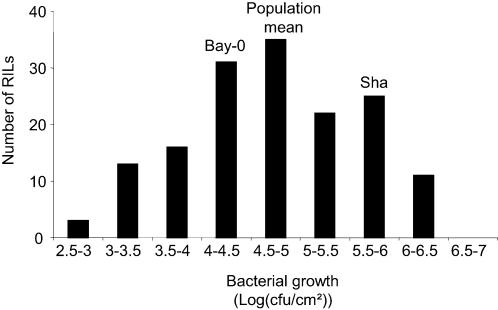
Figure 2.
Distribution of bacterial growth values in the Bay-0×Shahdara recombinant inbred line (RIL) population. The frequency histogram shows the range of in planta bacterial populations observed in RILs three days post inoculation with Pseudomonas syringae pv. tomato DC3000 in one of the greenhouse experiments. The values obtained for the parental accessions, Bay-0 and Shahdara (Sha), and the genetic mean of the population are indicated.

