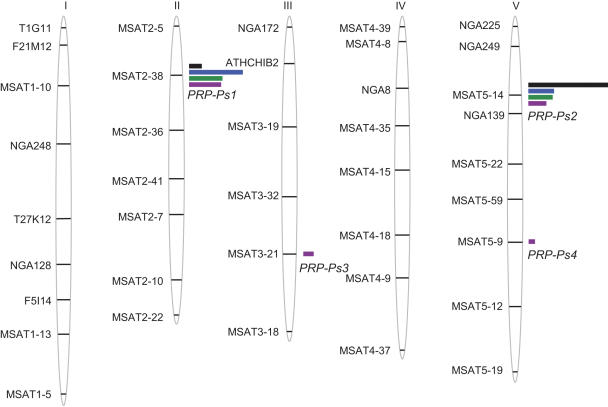
Figure 3.
Arabidopsis QTLs controlling partial resistance to Pseudomonas syringae pv. tomato DC3000 in the Bay-0×Shahdara recombinant inbred line population. The detected QTLs are represented by bars located at the closest marker position (black, experiment 1; blue, experiment 2; green, experiment 3; purple, experiment 4) on the Bay-0×Shahdara genetic map [34]. The length of the bar is proportional to the QTL effect (R2).

