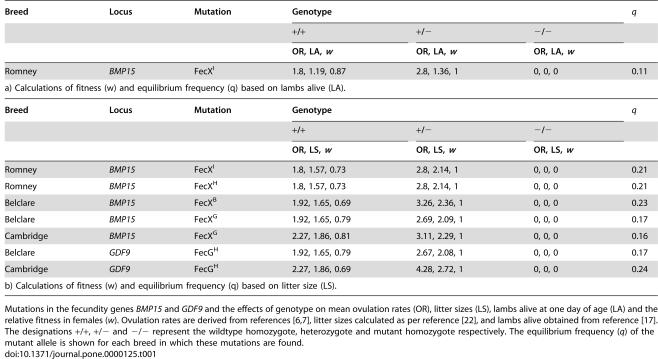
| Breed | Locus | Mutation | Genotype | q | ||
| +/+ | +/− | −/− | ||||
| OR, LS, w | OR, LS, w | OR, LS, w | ||||
| Romney | BMP15 | FecXI | 1.8, 1.57, 0.73 | 2.8, 2.14, 1 | 0, 0, 0 | 0.21 |
| Romney | BMP15 | FecXH | 1.8, 1.57, 0.73 | 2.8, 2.14, 1 | 0, 0, 0 | 0.21 |
| Belclare | BMP15 | FecXB | 1.92, 1.65, 0.69 | 3.26, 2.36, 1 | 0, 0, 0 | 0.23 |
| Belclare | BMP15 | FecXG | 1.92, 1.65, 0.79 | 2.69, 2.09, 1 | 0, 0, 0 | 0.17 |
| Cambridge | BMP15 | FecXG | 2.27, 1.86, 0.81 | 3.11, 2.29, 1 | 0, 0, 0 | 0.16 |
| Belclare | GDF9 | FecGH | 1.92, 1.65, 0.79 | 2.67, 2.08, 1 | 0, 0, 0 | 0.17 |
| Cambridge | GDF9 | FecGH | 2.27, 1.86, 0.69 | 4.28, 2.72, 1 | 0, 0, 0 | 0.24 |
| b) Calculations of fitness (w) and equilibrium frequency (q) based on litter size (LS). | ||||||
Mutations in the fecundity genes BMP15 and GDF9 and the effects of genotype on mean ovulation rates (OR), litter sizes (LS), lambs alive at one day of age (LA) and the relative fitness in females (w). Ovulation rates are derived from references [6], [7], litter sizes calculated as per reference [22], and lambs alive obtained from reference [17]. The designations +/+, +/− and −/− represent the wildtype homozygote, heterozygote and mutant homozygote respectively. The equilibrium frequency (q) of the mutant allele is shown for each breed in which these mutations are found.

