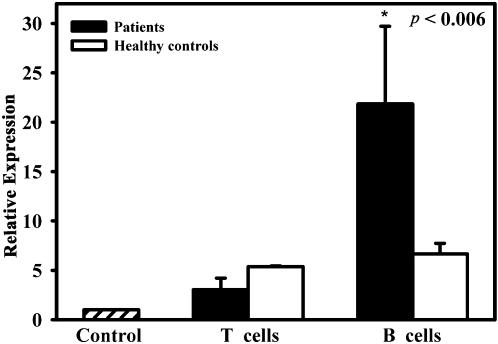
Figure 2. Quantitative analysis of IL-7 expression in T and B cells.
IL-7 expression was evaluated by RQ-PCR using 2−ΔΔCt method. B cells derived from cancer patients expressed significantly higher levels of IL-7 compared to T cells. Both T and B cells from healthy controls expressed less IL-7 than patients. The control bar represents the negative control: IL-7 expression in H522 cell line. Data are means±SE of nine independent experiments.

