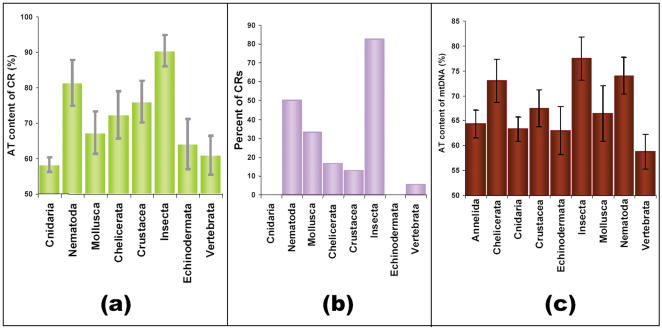
Figure 3.
(a) Mean AT content of CR (%) of mitochondrial CRs (n = 393) and (b) % of mitochondrial CRs having palindromes in different animal groups (n = 387). (c) Mean AT content of CR (%) of complete mitochondrial sequences of different animal groups (n = 201). Data was obtained from analysis of 8 animal groups.

