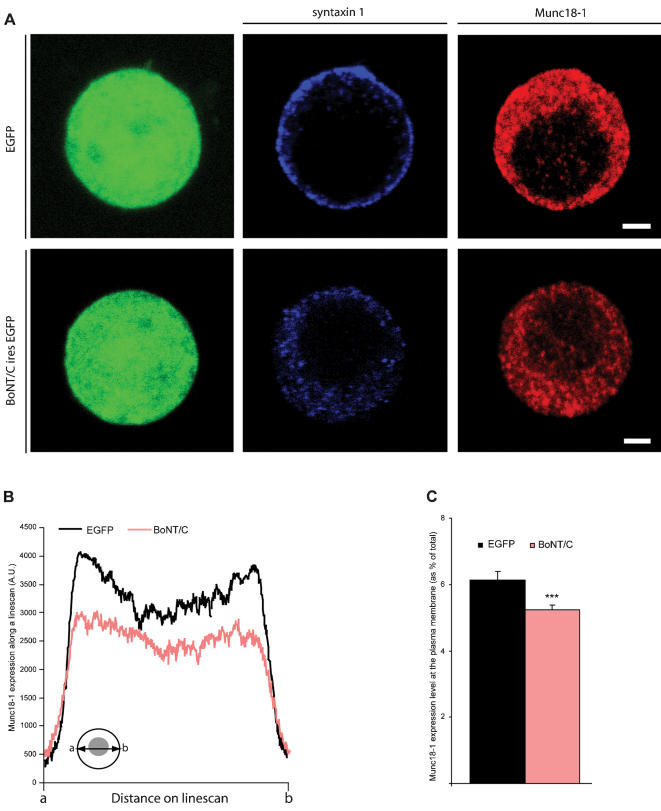
Figure 5.
Distribution of Munc18-1 is altered in syntaxin deleted chromaffin cells. (A) Immunolocalization of syntaxin (blue) and Munc18-1 (red) in SFV-egfp or BoNT/C-ires-egfp infected chromaffin cells. Scale bars represent 2 µm. (B) Average pixel intensity of Munc18-1 expression obtained from line scans through a confocal section of a BoNT/C and EGFP expressing cell. Inset shows how line scans were made from a to b (C) Quantification of the Munc18-1 expression at the plasma membrane. Numbers indicate mean±SEM. from n = 22 cells and N = 3 animals (***p<0.01, ANOVA and student's t-test, comparison to control).

