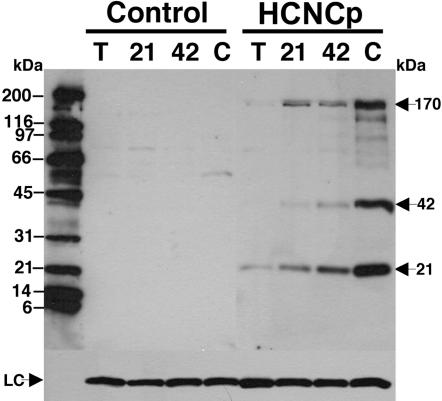
Figure 2. Expression of HCNCp During Differentiation.
Full length epitope-tagged HCNCp protein (arrow at 170 kDa) was detected beginning at 21 hr encystation (“21”) and was at peak levels at the cyst (“C”) stage.
Proteins having an AU1 tag and relative molecular masses of 42 and 21 kDa also increased during encystation (arrows).
Anti-AU1 antibodies did not react to non-transfected “control” trophozoites (“T”) or encysting cells (“21”, “42”, or “C”).
Size markers are indicated by dashes on the left side of figure in kDa and the taglin loading control is shown at the bottom of the figure (“LC”).

