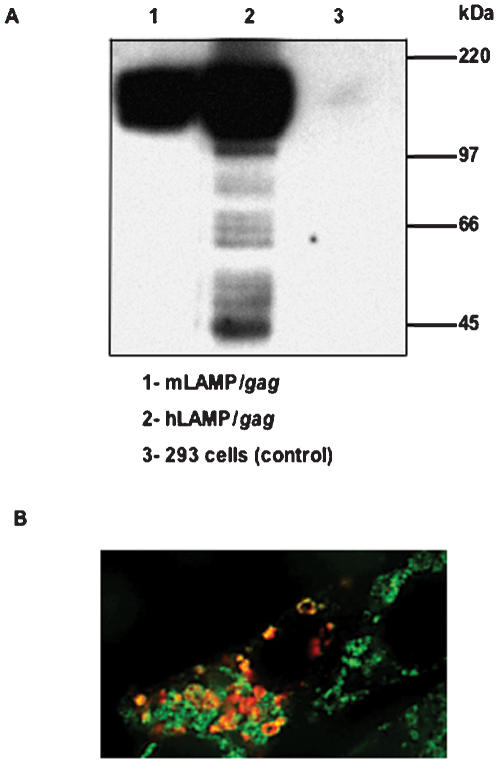
Figure 1. Expression and trafficking of mouse and human LAMP/gag.
(A) Western blot analysis of human 293 cells transfected with mLAMP/gag and hLAMP/gag plasmids. Samples were probed with an anti-Gag monoclonal antibody. The molecular weight markers are indicated on the right. (B) DCEK cells were transfected with the hLAMP/gag plasmid and stained with anti-Gag (red) or anti-MHC II (green) monoclonal antibodies. Digitally merged image shows co-localization of the hLAMP/gag chimera- and MHC II-containing compartments (yellow).

