Figure 3.
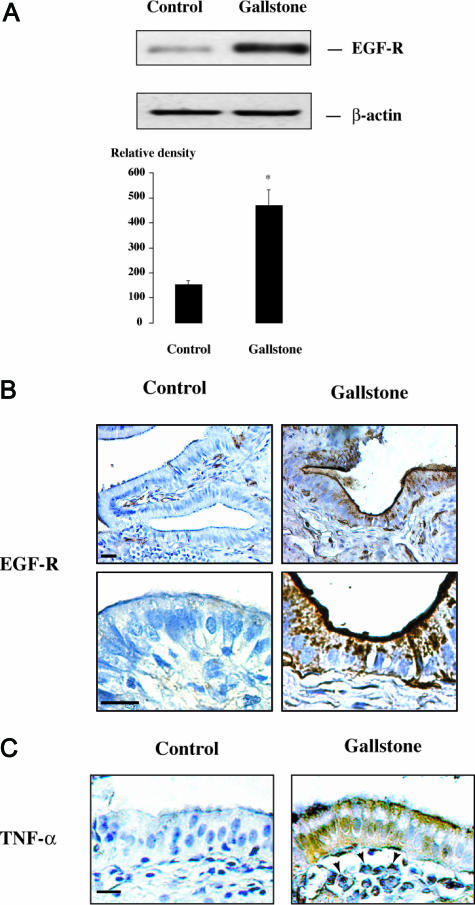
EGF-R and TNF-α expression in gallstone disease. A: Representative Western blot of EGF-R and β-actin in freshly isolated gallbladder epithelial cells from a control subject and from a subject with gallstones. In quantitative analysis, results are expressed as the ratio of EGF-R to β-actin signals. They represent the mean ± SEM of three preparations; *P < 0.05 versus control. B: Representative photomicrographs at low (top) and high (bottom) magnifications of EGF-R immunolabeling in gallbladder tissue sections from controls and subjects with gallstones. In the control specimen (left), EGF-R immunoreactivity is weak in the epithelium; in the specimen with gallstones (right), EGF-R immunoreactivity is intense and located predominantly in the apical region of epithelial cells but also in their basal region (bottom right). Bar = 50 μm; original magnification: top panels, ×100; bottom panels, ×400. C: Photomicrographs of gallbladder tissue sections labeled for TNF-α showing no labeling in a control specimen (left), whereas in a gallbladder with gallstones, TNF-α immunoreactivity is detected within both the epithelium and inflammatory cells in the subepithelium (right, arrowheads). Bar = 50 μm; original magnification, ×200.

