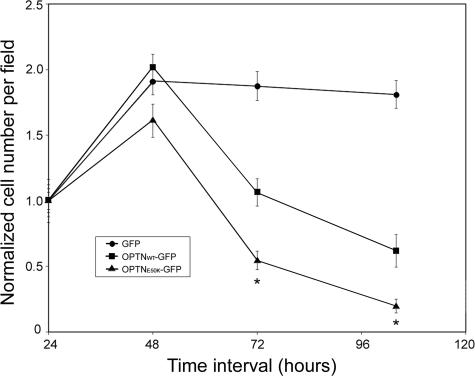
Figure 9.
Quantification of cell death after transfection of OPTNWT and OPTNE50K. RPE cells transiently expressing GFP alone (-•-), OPTNWT-GFP (-▪-), or OPTNE50K-GFP (-▴-) were grown on glass chamber slides. Images in selected five to six 10× fields, each containing at least 50 transfected cells, were captured after washing at 24-hour intervals for 4 days. The number of transfected cells in the same fields was counted using Metamorph software. Results are expressed as number of transfectants per field (mean ± SEM, n = 6) after normalization to that at the 24-hour time point. Compared with the GFP control, cell death was noticed from 72 hours on in OPTNWT- and OPTNE50K-overexpressing cells (P < 0.001). *P < 0.01 compared with OPTNWT-GFP.

