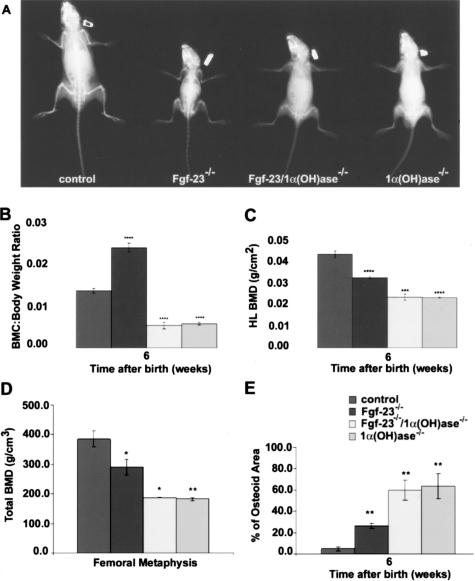
Figure 2.
A: X-ray autoradiography of total skeletons of a control, Fgf-23−/−, Fgf-23−/−/1α(OH)ase−/−, and 1α(OH)ase−/− animal at 6 weeks. B–D: Total BMC (B, each value obtained for BMC was normalized to the body weight of the corresponding animal), and BMD (C and D) by PIXImus and pQCT of hindlimbs of control, Fgf-23−/−, Fgf-23−/−/1α(OH)ase−/−, and 1α(OH)ase−/− animals are shown. E: Quantitative histomorphometry on osteoid volume of control, Fgf-23−/−, Fgf-23−/−/1α(OH)ase−/−, and 1α(OH)ase−/− animals (statistical significance: *P < 0.05, **P < 0.01,***P < 0.001, ****P < 0.0001). There was no statistical significant difference between WT (Fgf-23+/+/1α(OH)ase+/+) and Fgf-23+/−/1α(OH)ase+/−, Fgf-23−/− and Fgf-23−/−/1α(OH)ase+/−, and Fgf-23−/−/1α(OH)ase−/− and 1α(OH)ase−/−/Fgf-23+/− animals, so data were combined.

