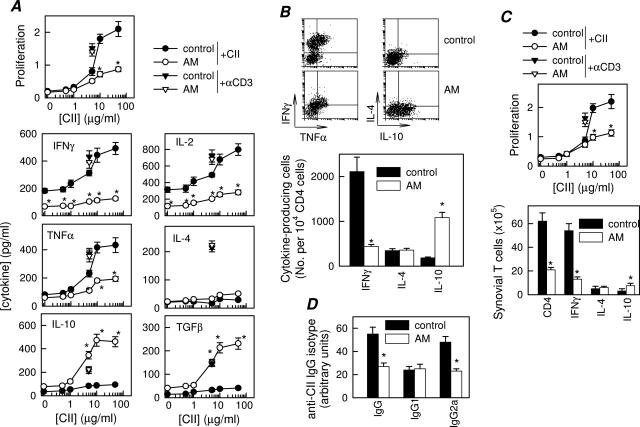
Figure 3.
AM down-regulates Th1-mediated response in CIA. A: Proliferative response and cytokine production of DLN cells isolated at day 30 from untreated (control) or AM-treated CIA mice and stimulated in vitro with different concentrations of CII. Stimulation of DLN cells with anti-CD3 antibodies (▾, for untreated CIA mice; ▿, for AM-treated CIA mice) was used for assessment of nonspecific stimulation. A pool of three nonimmunized DBA/1 DLN cells was used for assessment of the basal response. No proliferation or cytokine production by T cells was detectable in the presence of an unrelated antigen (OVA). n = 5 mice per group. B: Number of CII-specific cytokine-producing T cells. DLN cells from untreated (control) or AM-treated CIA mice were restimulated in vitro with CII (10 μg/ml) and analyzed for CD4 and intracellular cytokine expression by flow cytometry. Dot plots show representative double staining for IFN-γ/TNF-α or IL-4/IL-10 expression in gated CD4 T cells. The number of IFN-γ-, IL-4-, and IL-10-expressing T cells relative to 104 CD4 T cells is shown in the bottom panel. Data shown represent pooled values from two independent experiments. C: CII-specific proliferative response and number of cytokine-producing CD4 T cells in synovial membrane cells isolated from untreated (control) or AM-treated CIA mice and stimulated in vitro with CII (10 μg/ml) for 48 hours. Data show the results of pooled synovial cells from three animals per group. D: CII-specific IgG, IgG1, and IgG2a levels in serum collected at day 35 from untreated (control) or AM-treated CIA mice (8 to 12 mice per group). *P < 0.001 versus controls.

