Figure 4.
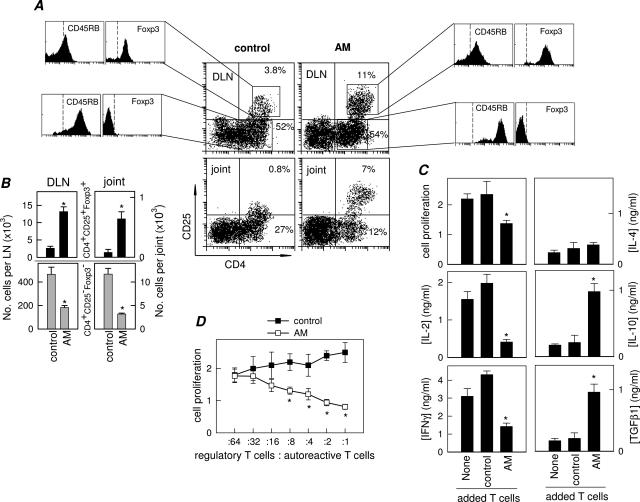
AM induces the emergence of regulatory CD4+CD25+ T cells in CIA. A: Flow cytometry analysis of DLN and synovial (joint) CD4+CD25+ cells isolated at day 30 from untreated (control) or AM-treated CIA mice. Numbers represent percentages of CD4+CD25− and CD4+CD25+ cells. Histograms show the expression of CD45RB and Foxp3 in gated CD4+CD25− and CD4+CD25+ cells in DLN. Similar profiles were observed for synovial cells. Dashed lines in histograms are isotype antibody controls. Data are representative of five mice per group. B: Number of CD4+CD25+Foxp3+ cells (black bars) and CD4+CD25−Foxp3− cells (gray bars) per DLN and synovial membrane (joint) isolated from untreated (control) and AM-treated CIA mice (six mice per group). C: Proliferative response and cytokine production of autoreactive T cells isolated from CIA mice stimulated with spleen APCs and CII (10 μg/ml) in the absence (none) or presence of DLN T cells isolated from untreated (control) or AM-treated CIA mice. n = 3 experiments performed in duplicate. D: Proliferative response of autoreactive T cells (4 × 10⁵ cells) isolated from CIA mice co-cultured with increasing numbers of DLN T cells (regulatory T cells) from untreated (control) or AM-treated CIA mice (ratios from 1:64 to 1:1), and stimulated with CII (10 μg/ml) and splenic APCs. n = 3 experiments performed in duplicate. *P < 0.01 versus controls.

