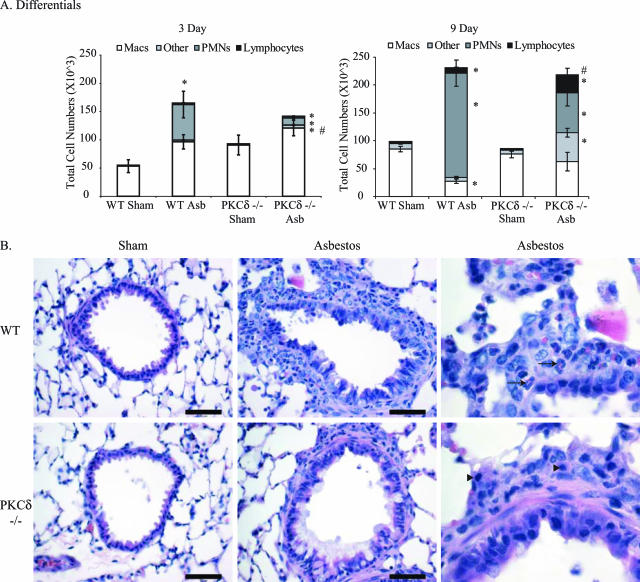
Figure 4.
PKCδ−/− mice show altered inflammatory profiles in BALF after asbestos inhalation. A: Differential cell counts on BALF at 3 and 9 days. *P ≤ 0.05, significantly different from respective sham group; #P ≤ 0.05, significantly different from WT Asb group. B: Histopathology of distal bronchioles at 9 days after H&E staining. In comparison to sham mice (left), asbestos-exposed mice show pronounced peribronchiolar inflammation that is characterized by predominantly neutrophil infiltration (arrows) in WT mice and lymphocytes in PKCδ−/− mice (arrowheads). Scale bars = 50 μm.

