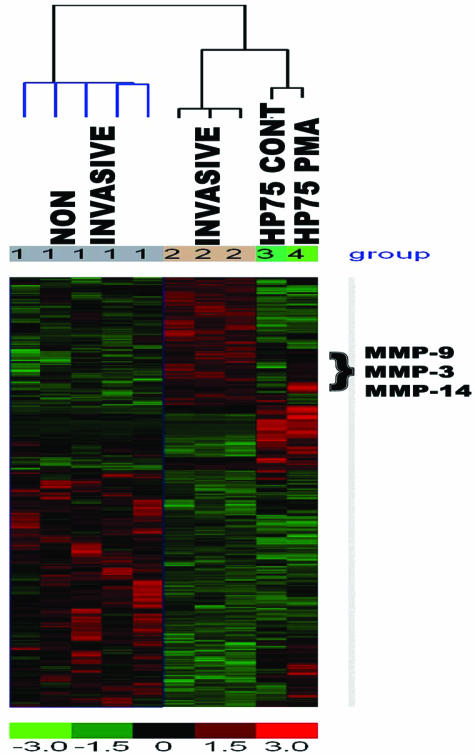
Figure 1.
Tumor invasion-associated cDNA microarray analysis. Hierarchical clustering of analysis reveals unique subsets of genes differentially expressed in invasive PAs compared with noninvasive tumors. Affymetrix HG 133 Plus 2.0 gene chips were used in the experiment, and each chip contained 54,613 transcripts. The cluster genes (n = 846) were derived from those greater than 1.5-fold change. The red color indicates up-regulation and the green color indicates genes that were down-regulated.

