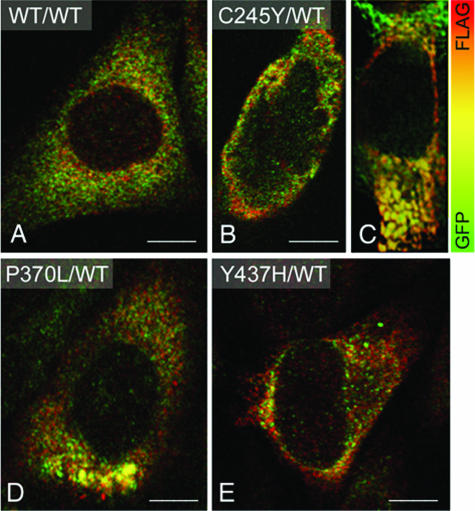
Figure 2.
Co-expression of mutant and WT MYOC results in intracellular aggregate formation. A: Merged double-confocal immunofluorescence images of HEK293 cells expressing WT MYOC-GFP (green) and FLAG-WT MYOC (red) shows overlapping MYOC distribution as indicated by the orange-yellow color. MYOC aggregates are undetectable. B and C: C245Y- and WT MYOC-expressing cells exhibit distinct cytoplasmic aggregates composed of both mutant and WT MYOC as indicated by the orange-yellow color. Distinct cytoplasmic aggregates of varying sizes are also observed in P370L and WT MYOC-expressing (D) or Y437H-expressing and WT MYOC-expressing cells (E). Scale bars = 5 μm.

