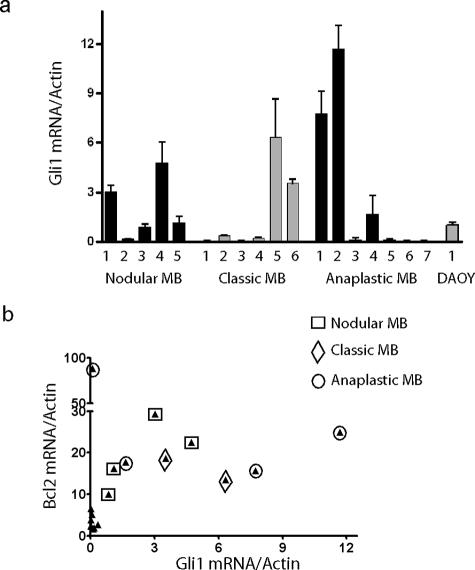
Figure 2.
Analysis of Gli and BclII mRNA expression. a: Gli1 expression was measured by quantitative RT-PCR in RNA extracted from five nodular, six classic, and seven anaplastic snap-frozen medulloblastomas, as well as the DAOY cell line. b: BclII mRNA levels in these 18 samples are compared with those of Gli1, with each tumor represented by a filled triangle. The subtype of tumors with above-median Gli1 or BclII expression is further designated using an open square, diamond, or circle.

