Figure 3.
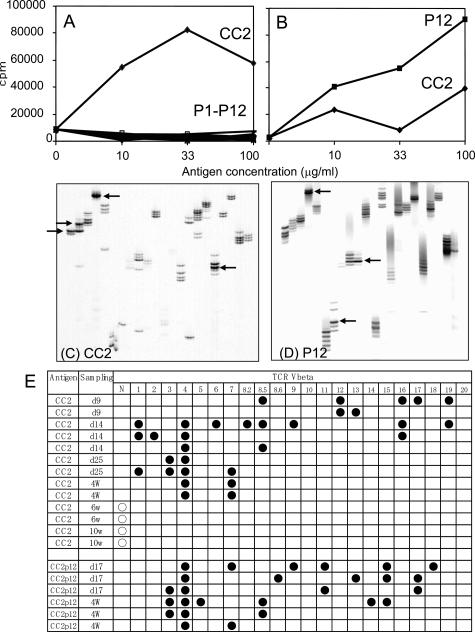
A and B: The proliferative responses of lymph node cells taken from CC2-immunized (A) and CC2P12-immunized (B) rats on day 12 PI. Lymph node cells (2 × 10⁵ cells/well) were cultured with the indicated antigen for 72 hours, with the last 18 hours in the presence of [3H]thymidine. The cells were harvested on glass-fiber filters, and the label uptake was determined using standard liquid scintillation techniques. Each symbol represents the mean value of triplicate assays, and SEMs were within 10% of the mean values. C and D: CDR3 spectratyping profiles of heart-infiltrating T cells taken from CC2-immunized (C) and CC2P12-immunized (D) rats. Marked spectratype expansions are indicated by arrows. E: Summary of the results of CDR3 spectratyping of T cells in the hearts from CC2- and CC2P12-immunized rats. Each line represents the result obtained from one rat. Closed circles represent Vβ clonal expansion. N, the normal spectratype pattern; w, weeks.

