Figure 3.
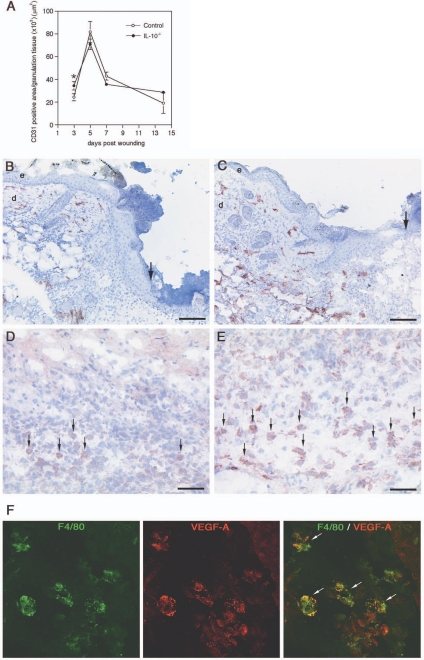
Angiogenesis in wounds of IL-10−/− and control mice. A: Computer-assisted morphometric quantification of CD31-positive cells within the granulation tissue of IL-10−/− and control mice during healing (*P < 0.04); data are expressed as mean ± SD, n = 3 wounds for each time point and group. B and C: CD31-stained blood vessels (red) 3 days after wounding; microvascular density is significantly increased in early granulation tissue of IL-10−/− mice when compared with control mice; arrows indicate the epithelial wound edge. D and E: VEGF-A staining (red) 3 days after wounding; arrows indicate VEGF-A-expressing mononuclear cells within the granulation tissue of control (D) and mutant mice (E). F: Double labeling for F4/80 (green) and VEGF-A (red) in granulation tissue of IL-10−/− mice indicates VEGF-A expression in macrophages. e, epidermis; d, dermis. Scale bars: 100 μm (B, C); 50 μm (D, E). Original magnifications, ×1000 (F).

