Figure 6.
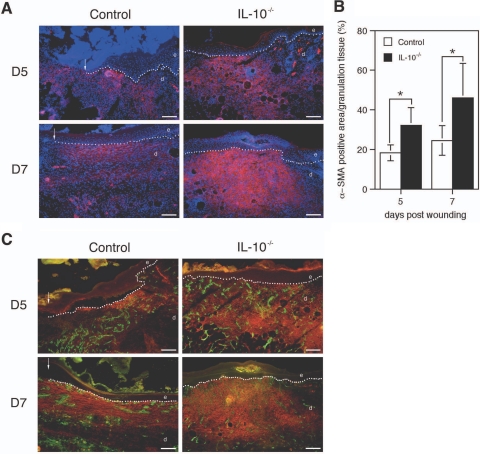
α-SMA expression in wounds of IL-10−/− and control mice. A: α-SMA immunostaining (red) of day 5 and day 7 wound tissue, DAPI counterstaining of nuclei (blue). B: Morphometric quantification of the area within the granulation tissue that stained positive for α-SMA at indicated time points after injury; data are expressed as means ± SD, n = 5 wounds for each time point and group (*P < 0.03). C: Double labeling of CD31 (green) and α-SMA actin (red) of day 5 and day 7 wound tissue. Note that in wounds of both mouse strains the α-SMA staining is found in the areas between the capillary structures, indicating the nonendothelial cell origin of this staining and suggesting the presence of myofibroblasts. e, epidermis; d, dermis; g, granulation tissue. Scale bars = 100 μm.

