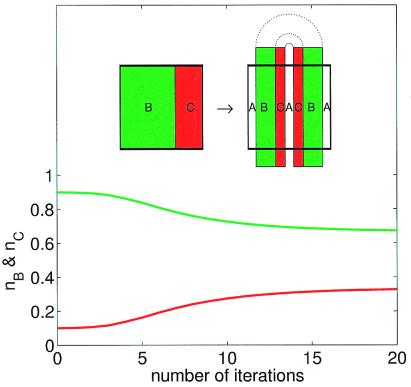
Figure 3.
Time evolution of the competitor densities in a baker map mixing model. The percentage nB (green line) and nC (red line) of B and C, respectively vs. the number of iterations of the baker map on the unit square. Species B and C occupy neighboring regions of A within a distance σB = 2σC = 1/500, and have mortality rates of δB = δC = 1/5. In spite of C being outnumbered 9:1 at the beginning of the simulation, C can coexist with B in the long time limit. (Inset) The stretching and folding action of one step of the baker map is illustrated. First, the unit square (shown in bold lines) is compressed by a factor a (=0.4) in horizontal direction and stretched by 1/a in the vertical direction while keeping the area constant. Next this stretched rectangle is folded in two over the unit square. This process is then iterated several times. Note that the “flow” described by the baker map is open because at each iteration of the map a portion (1 − 2a) of particles leaves the unit square and is being replaced by regions of the background material A.

