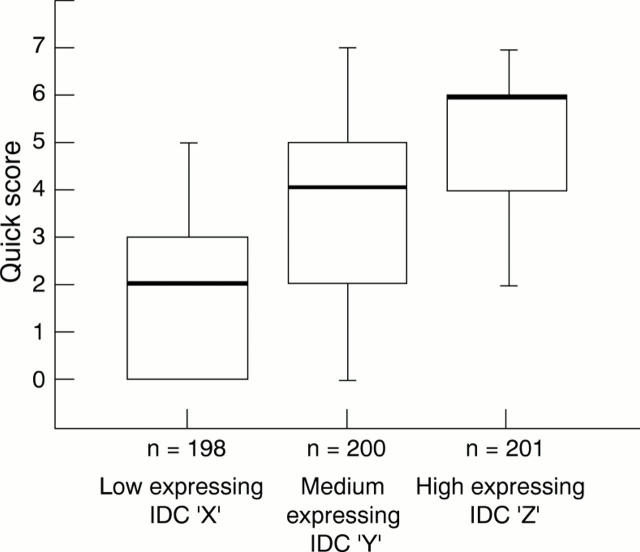
Figure 1 Distribution of the results of the "Quick" score evaluation conducted on the three infiltrating ductal carcinomas (IDC), X, Y, Z, used at assessment. The bold line represents the median score, the bottom and top of the boxes, the 1st and 3rd quartiles, respectively, and the range bars, the lowest and highest scores, respectively. The slightly different numbers for the three tumours reflect loss of tissue from the microscope slides; n, number of participating laboratories.

An official website of the United States government
Here's how you know
Official websites use .gov
A
.gov website belongs to an official
government organization in the United States.
Secure .gov websites use HTTPS
A lock (
) or https:// means you've safely
connected to the .gov website. Share sensitive
information only on official, secure websites.
