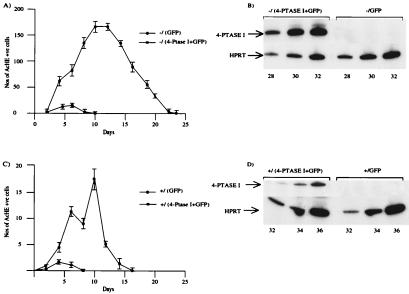
Figure 2.
(A) Growth curves of primary megakaryocytes from GATA-1− progenitors. Progenitors infected with one of two different retroviruses, one containing human 4-Ptase I and GFP and the other just GFP on its own. Selected progenitors then were expanded in liquid culture with 1% recombinant thrombopoietin-conditioned tissue culture medium. The number of cells with acetylcholinesterase activity in 20-μl aliquots of the culture is shown as a function of the duration of culture. The values shown are an average ± 1 SD from three experiments. (B) Human 4-Ptase I expression was assayed by RT-PCR in aliquots of the two retrovirally infected GATA-1− cultures in A. (Upper) Human 4-Ptase I expression was assayed, and the input amount of cDNA was normalized with respect to HPRT expression (Lower). The number of PCR cycles is shown at the bottom. (C) Growth curves of primary megakaryocytes from retrovirally infected progenitors of normal littermate embryos of GATA-1− embryos. The growth curves were performed in the same manner as A. Note the different ordinates in A versus C. (D) Human 4-Ptase I expression was assayed by RT-PCR in aliquots of the two retrovirally infected cultures of normal progenitors in C. The RT-PCR analysis is illustrated as in B.

