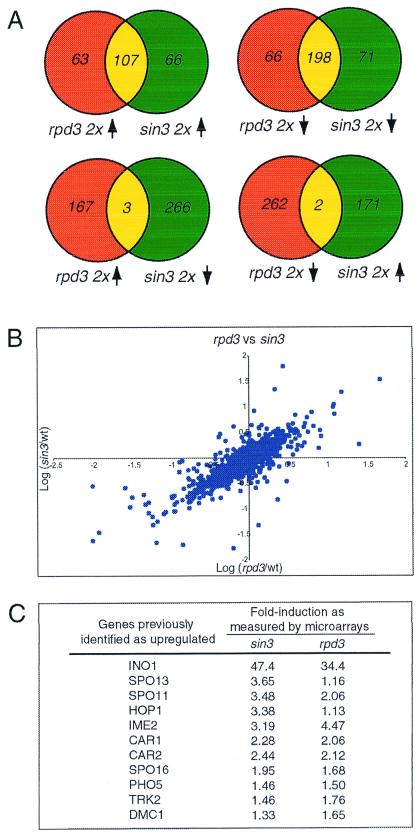
Figure 1.
The rpd3 and sin3 profiles are highly similar. (A) Venn diagrams comparing sets of up- and down-regulated genes from the rpd3 and sin3 data sets. (B) Plot of sin3-derived ratios vs. rpd3-derived expression ratios for each gene. A correlation of 0.85 is observed between the two data sets. (C) Transcripts previously identified as up-regulated in rpd3 or sin3 are also observed to be up-regulated in the microarray data.

