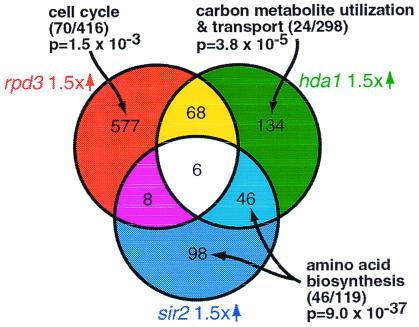
Figure 6.
RPD3, HDA1, and SIR2 influence distinct functional classes. Lists of genes up-regulated at least 1.5-fold in the rpd3, hda1, and sir2 (12) profiles are compared in a Venn diagram. Bioinformatic analysis suggests that RPD3 influences cell cycle progression, HDA1 influences carbon metabolite and carbohydrate transport and utilization, and SIR2 influences amino acid biosynthesis. The number of genes in the functional class regulated by the deletion/total number of genes in the functional class are shown in parentheses.

