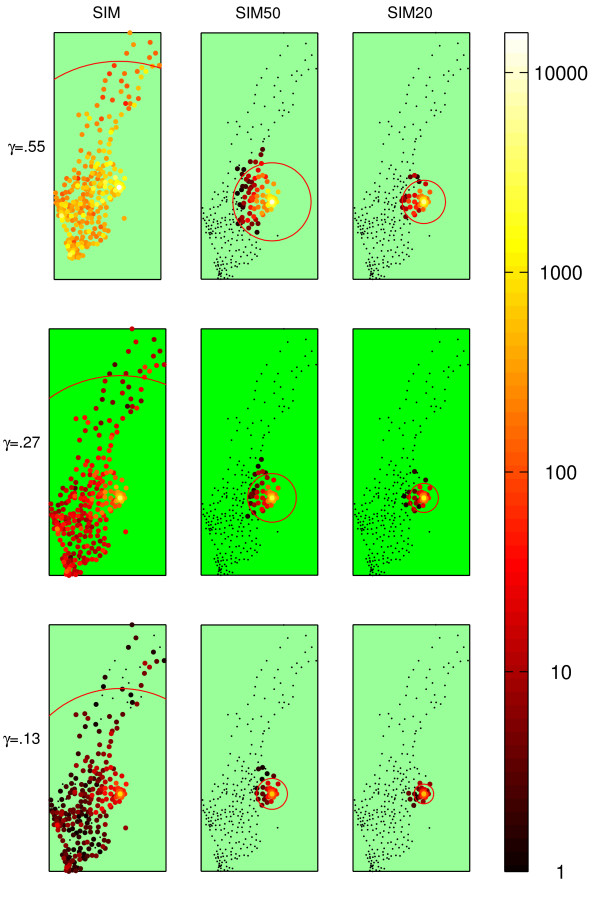
Figure 2.
Epidemic spread for different restrictions and values of γ. Geographical plot of the municipalities, logarithmically color-coded according to the mean incidence after 60 days. SIM depicts the complete data set. In SIM50 and SIM20, all journeys > 50 km and 20 km, respectively, have been removed. The red circle signifies the mean extent of the epidemic from Stockholm.

