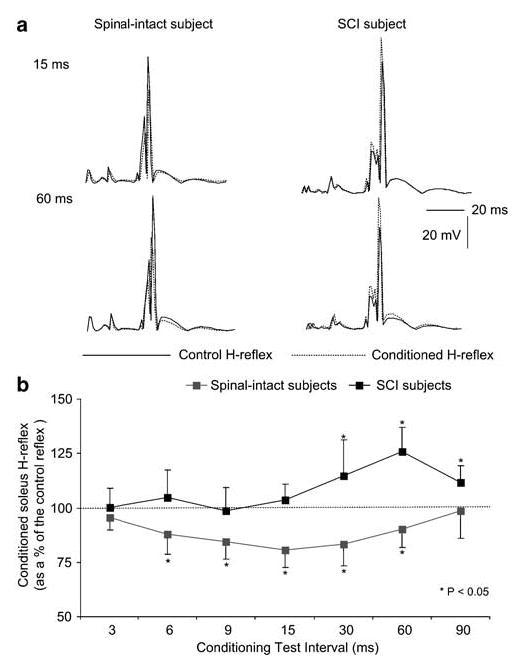
Figure 1.

Effects of plantar cutaneous afferent excitation on the soleus H-reflex in normal and SCI subjects. (a) The average soleus H-reflex (n = 20) under control conditions (solid lines) and during conditioning of the reflex (dashed lines) at 15 and 60 ms of conditioning test (C-T) intervals for one normal and one SCI subject is indicated. (b) Pool data showing the effects of plantar cutaneous afferents excitation on the soleus H-reflex in normal and SCI subjects. For each C-T interval tested, the overall average (mean±SEM) size of the conditioned H-reflexes for both subject groups is indicated. Asterisks indicate cases of statistically significant differences between the control and the conditioned reflex sizes (P < 0.05)
