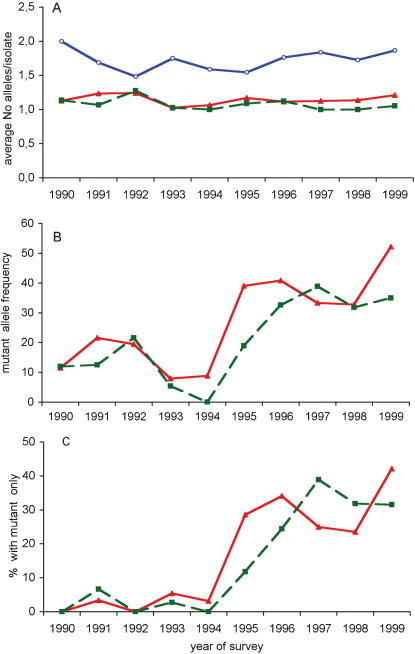
Figure 2. Temporal variation of the multiplicity of infection in Dielmo (A), frequency of Pfcrt codon 76 and Pfdhfr-ts codon 108 genotypes (B) and frequency of infections with only mutant type detected (C).
The number of isolates typed at each locus is indicated in Table 1. (A). Multiplicity of infection is depicted separately for each locus. For Pfmsp1 block2, the figures derive from nested PCR analysis using family-specific primers and allele identification based on allelic family assignment and size polymorphism. For Pfcrt and Pfdfhr-ts, it is based on K76T and S108N genotypes determined by molecular beacons, respectively. Symbols used: (Red triangles): Pfcrt codon 76 genotype; (green squares): Pfdhr-ts codon 108 genotype, (blue open circles) Pfmsp1 block2.
B) Allelic frequency of resistance genotypes, calculated as percentage of mutant genotype within the total number of alleles detected for each locus. Symbols used as in A.
C) Percentage of isolates containing only the mutant type. Symbols used as in A.

