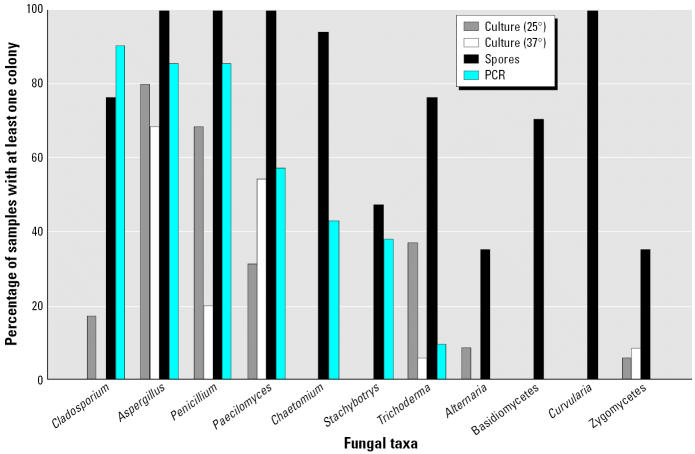
Figure 3.
Frequency of fungal taxa in samples of indoor and outdoor air from the three houses and during different timepoints grouped together. The sample size limited interpretation when stratifying by location and timepoints. Culture at 25°C (n = 35); culture at 37°C (n = 35); spore counting (n = 17); and PCR (n = 21).

