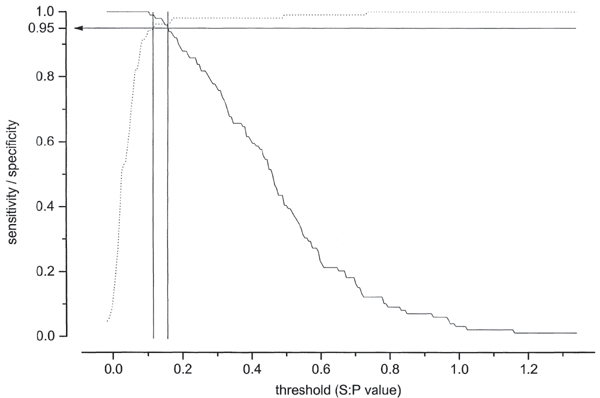
Figure 2.

Two-graph receiver operating curve (TG-ROC) analysis for 205 sera from blue foxes tested in the E. cuniculi ELISA. Based on CIA results, the 2 graphs represent sensitivity (solid line) and specificity (dotted line) for thresholds of the ELISA S:P values, where the intersection is the point were sensitivity and specificity are equal. An intermediate range lies between 2 cut-off values were sensitivity and specificity are 0.95, respectively. ELISA results below the lower cut-off value are considered negative, and S:P values above the upper cut-off value are positive. The S:P values represent only wells coated with E. cuniculi.
