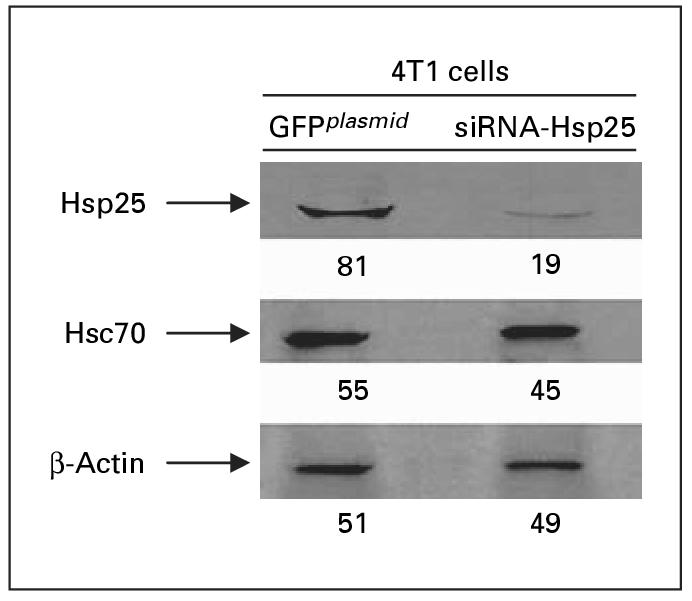
Fig. 3.

Suppression of Hsp25 expression in 4T1 breast adenocarcinoma cells. Freshly sorted GFPplasmid or siRNA-Hsp25 transfectants were lyzed, and extracted proteins were analyzed by 12% SDS-PAGE and immunoblotted with antibodies specific to Hsp25 or Hsc70 and visualized with a coupled secondary antibody chemiluminescence method. Anti-β-actin antibody was used as loading control on stripped Hsp25 membranes. The intensities of the bands were analyzed by densitometry with a video densitometer (Chemilmager ™ 5500; Alpha Innotech, San Leandro, Calif., USA) using the American Applied Biology software. Figures represent relative density. Results are representative of three independently performed experiments with similar results.
