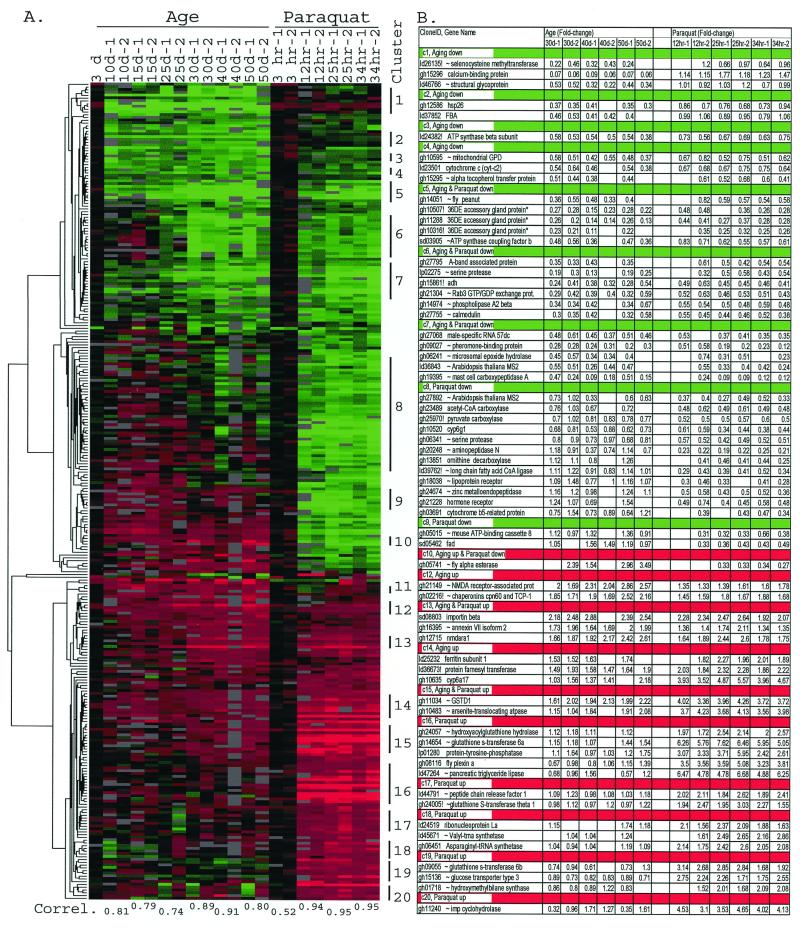
Figure 4.
CLUSTER image. (A) CLUSTER image of 295 age-regulated and/or paraquat-regulated ESTs. The cluster is subdivided further into 20 clusters, indicated by the number. The symbols and color coding used in this figure are the same as those used in Fig. 3. Correl. represents Pearson's correlation coefficient. (B) Gene list. The ESTs with clone identification codes and sequence information are shown with Cy5/Cy3 ratios at six time points: 30, 40, and 50 days for the aging experiments and 12, 25, and 34 h for the paraquat experiments. Two independent values for each time point are listed side by side. The order of the ESTs in the table is the same as their relative positions in the cluster image shown in A. Cluster identification is indicated by “c” followed by the number, and coded with two colors—green indicates down-regulation, and red indicates up-regulation.

