
Figure 1.
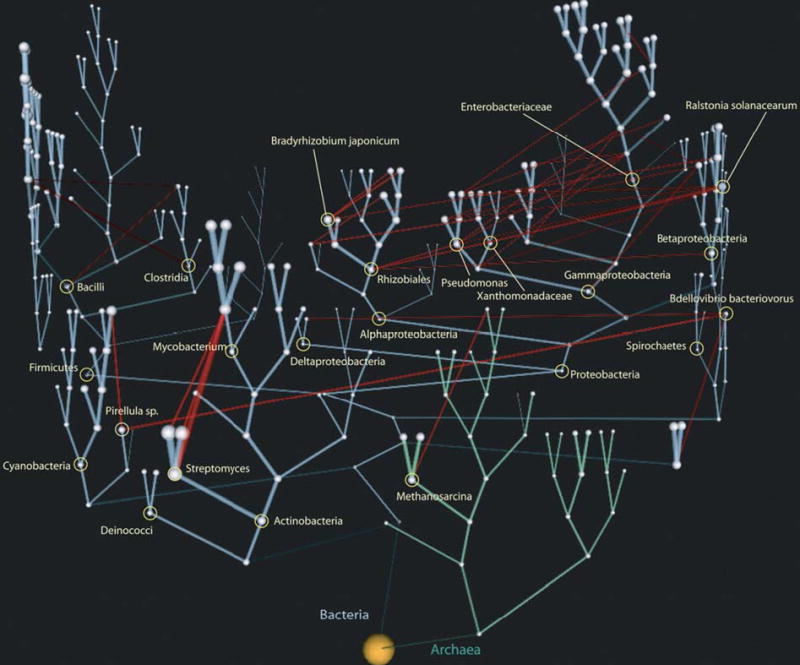
The tree of life in three dimensions. The plot, taken from [8•], reflects the ‘genome conservation’ and ‘horizontal gene transfer vine width’ data. Individual taxonomic nodes are shown as white spheres, the diameters of which reflect the number of node-specific gene families. The bacterial phylogenetic tree is in cyan and the archaeal tree in light green. Red lines indicate the horizontal gene transfer. The width of each line reflects the number of gene families transferred along that line. Reprinted with permission from Genome Res 2005, 15:954–959.