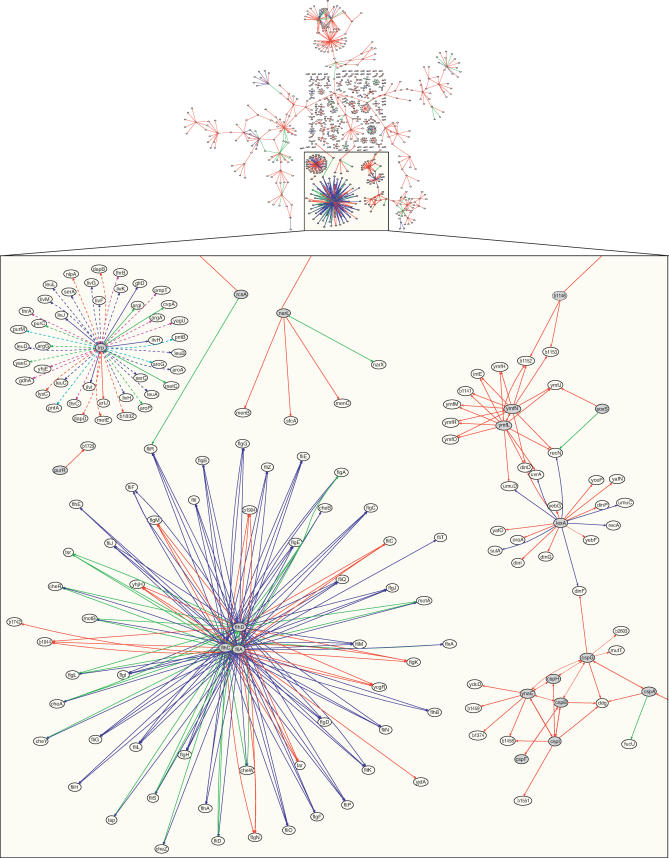
Figure 3. The Transcriptional Regulatory Map Inferred by CLR with an Estimated 60% Precision.
The precision of the network is obtained by measuring the percentage of correctly inferred edges (blue lines) out of all the predicted edges for genes with known connectivity (blue lines and green lines). The green edges represent false positives based on RegulonDB. The red edges connect genes/regulators not present in RegulonDB. A portion of the regulatory map containing many of the Lrp interactions is shown in the expanded box. Dotted lines were tested by ChIP. Magenta and cyan dotted lines are previously unknown targets of Lrp, experimentally verified by ChIP. Genes attached to cyan lines previously had no known regulator, whereas magenta indicates a gene that had at least one previously known regulator.

